Products
Solutions
Resources
9977 N 90th Street, Suite 250 Scottsdale, AZ 85258 | 1-800-637-7496
© 2024 InEight, Inc. All Rights Reserved | Privacy Statement | Terms of Service | Cookie Policy | Do not sell/share my information

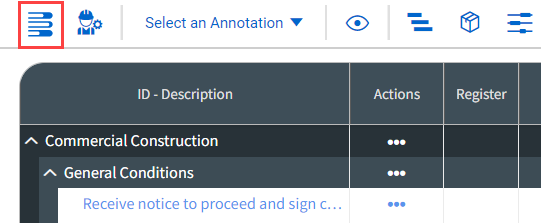
Click the Scheduling icon in the Smart Planning tab.
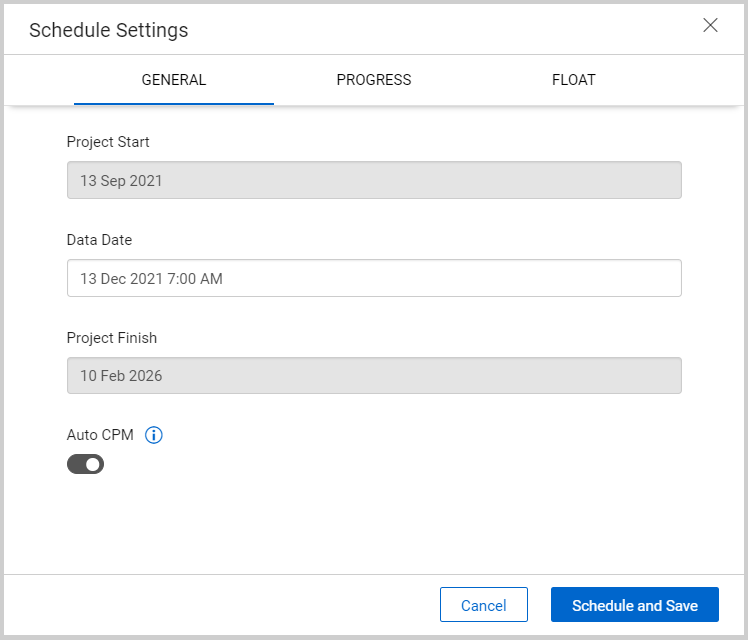
Populate the following information on the General tab:
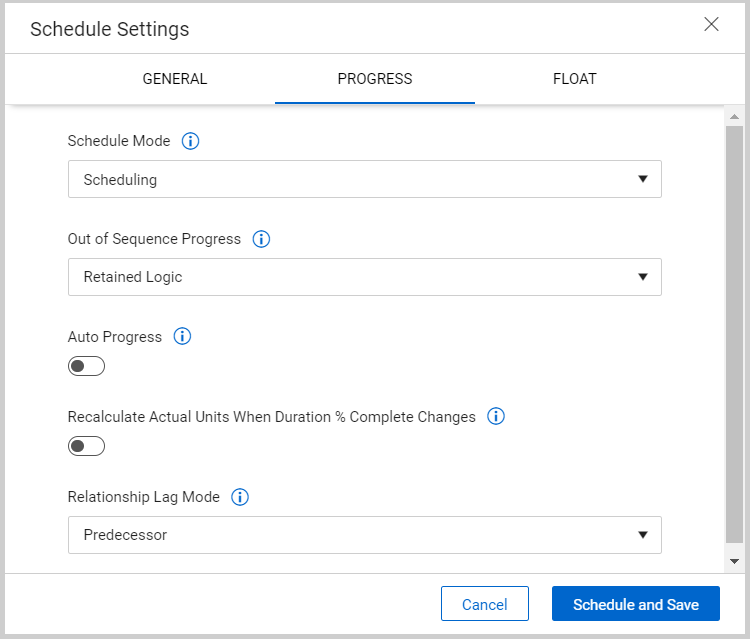
Populate the following information on the Progress tab:
Auto Progress - If set to On, Schedule assumes that work is proceeding as planned. Activities will be progressed to where they were planned to be on the data date. If set to Off, you manually progress activities. This should be done prior to advancing the data date of the project.
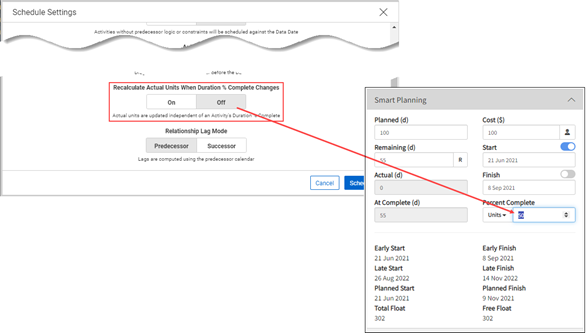
Recalculate Actual Units When Duration % Complete Changes - Actual units on assigned resources update per the duration % complete. For example, if a 10-day activity is progressed to 50% duration % complete then a resource assigned to that activity with 100 units planned would update to 50 actual units. Off - Duration % complete and Actual units are unlinked.
Relationship Lag Mode -Dictates which calendar between a predecessor and its successor the lag of a relationship is used when establishing Finish and Start dates in CPM.
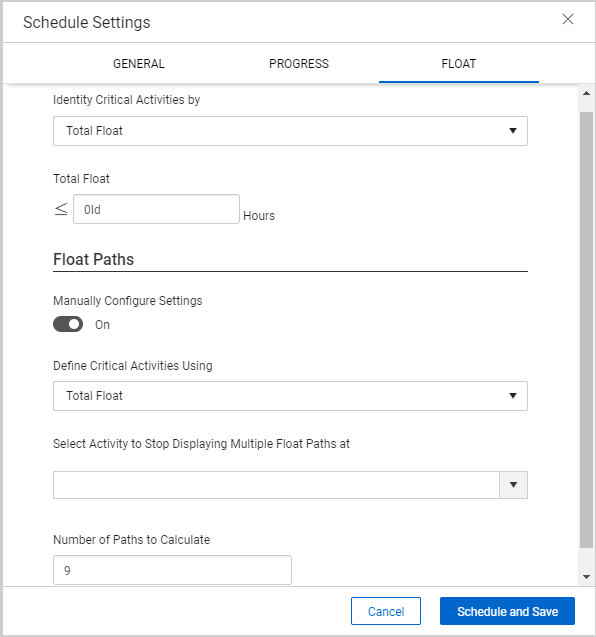
Populate the following information on the Float tab:
Identify Critical Activities by - Identify critical activities by either the Total Float or the Longest Path. If the Total Float value is less than or equal to the defined number of hours (default 0) then it is an indication that an activity is critical. The Longest Path is the path through a project network from start to finish where the Total Duration is longer than any other path.
Total Float - Set the Total float to less than or equal to 8 hours. The Total Float represents the amount of time a task can be delayed without affecting the completion date of the project.
Manually Configure Settings - Set the Manually Configure Settings to On.
Define Critical Activities Using - You can define critical activities using either Total Float or Free Float. Free Float represents the amount of time a task can be delayed without affecting the start date of its subsequent tasks.
Number of Paths to Calculate - You can calculate up to 10 sub-critical paths. This helps you to better envision the activities that have a potential of being delayed, which gives you additional time and consideration to push out the schedule. You can choose to execute certain actions such as defining the critical activities by using either free float or total float, select an activity to stop showing multiple float paths, and determine the number of float paths to calculate.
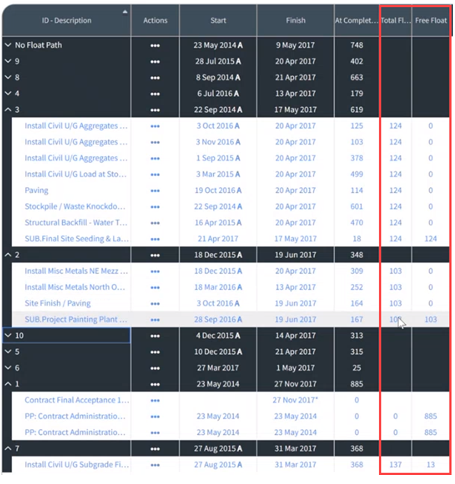
To see the float paths in Plan view, you can group by float path in the Group By Builder to see which activities are critical and sub-critical, and the float path where they reside.
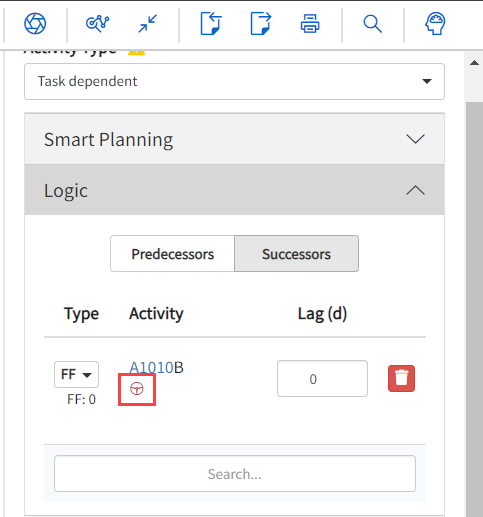
The driving indicator (steering wheel) appears in the Logic section of the IRIS panel. The driving indicator indicates that a predecessor or successor is on the critical path.
To begin Progressing, select the activity that you want to progress, and reference the smart planning panel.
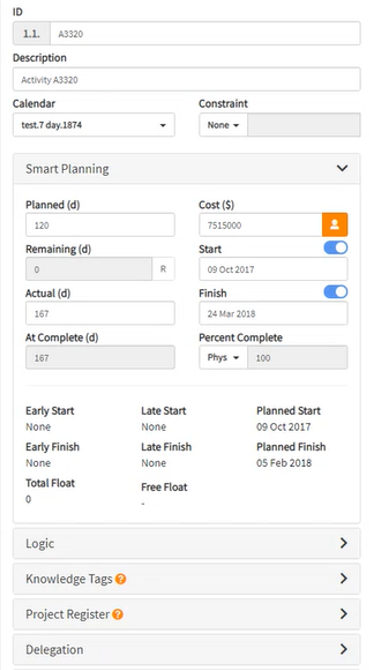
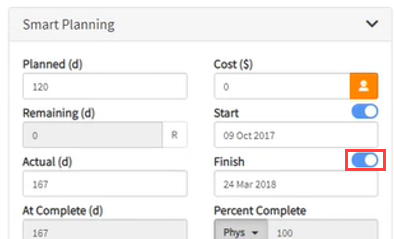
Activities can be marked as started by clicking the Start toggle. As activities progress, they can be updated by changing the remaining duration, the finish date, or the Percent Complete fields. When a task is finished, the Finish flag can be switched to On to indicate this in the system.
Percent complete can be calculated in three different ways:
Duration
Units
Physical

Duration percent complete uses the duration that was originally loaded onto the activity. For example, if the duration was set to ten days for completion and only five days have been completed, the system automatically sets duration to 50 percent complete.
Units percent complete uses the resource budgeted units. Schedule uses any units that have been budgeted to that activity to automatically calculate the percent complete. For example, if there are 100 man hours someone needs to work and they only worked 50 hours, the system would calculate it to 50% complete.
You can also update the Units Percent Complete at the activity level. When the Recalculate Actual Units When Duration % Complete Changes toggle in Schedule Settings is set to Off, you can manually edit the Unit Percent Complete field in Smart Planning.
Updating the Units Percent Complete at the activity level in Smart Planning also updates the actual and remaining for the associated resource assignments.
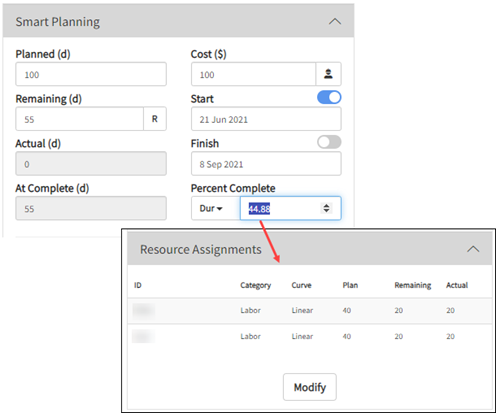
You can modify the resource assignment, which automatically recalculates and updates the Duration Percent Complete in Smart Planning.

Physical percent complete uses the Phys % Complete column as a text field to type in the percent complete. This only applies to an activity that has started and is not completed. Physical percent complete interacts with earned value management. For example, if you have 20% physical complete and 5% duration complete, there are three ways of updating this. You can change the remaining duration, you can change the finish date, or you can change the duration percent complete. The system automatically adjusts the math.

In the Available Columns column, scroll to the Duration section. Then select the following columns for percent complete:
% Complete
% Complete Type
Dur % Complete
Phys % Complete
Unit % Complete
Use the arrows to move the columns to the Selected Columns column.
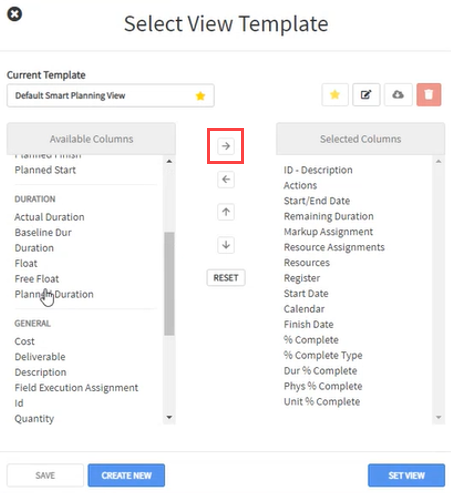
Select Set View to add the percent complete columns to the Gantt chart.
Additional Information
9977 N 90th Street, Suite 250 Scottsdale, AZ 85258 | 1-800-637-7496
© 2024 InEight, Inc. All Rights Reserved | Privacy Statement | Terms of Service | Cookie Policy | Do not sell/share my information